Discrete vs Continuous Data
Average reading time: 12 minute(s)
Understanding the Differences in Discrete vs Continuous Data and Their Impact
Two fundamental types of quantitative data are discrete and continuous data. Understanding these types is critical for accurate data collection, analysis, and decision-making across fields like business, science, geography, and data protection. This comprehensive guide explores what discrete and continuous data are, how they differ, their applications, and why knowing their distinctions matters in modern data management.
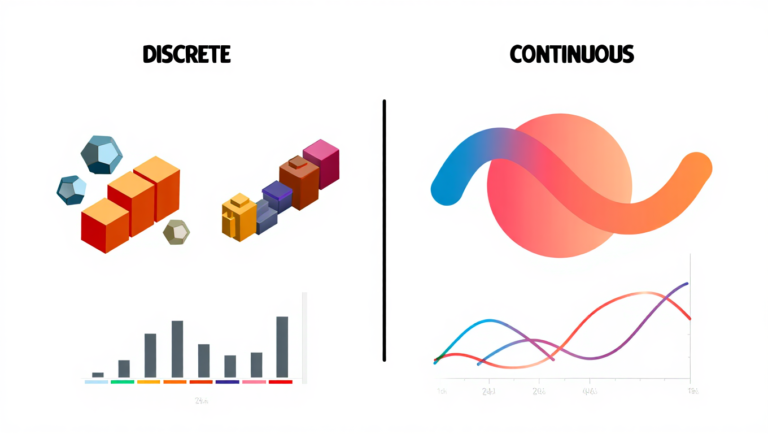
Visual Overview: Discrete vs Continuous Data
Discrete Data
Countable & Separate
Continuous Data
Measurable & Flowing
Discrete Versus Continuous Features
At its core, the difference between discrete and continuous data comes down to whether the data values are countable, separate units or part of a continuous flow. Discrete data represents distinct, separate values with clear boundaries, like the number of cars in a parking lot or the count of employees in a company. In contrast, continuous data can take any value within a range, like temperature readings or elevation, where the values flow smoothly without abrupt jumps.
In geographic information systems (GIS), for example, discrete features include objects like buildings, roads, and land parcels that have precise edges. Continuous features represent surfaces such as elevation or rainfall, where values change gradually over space without clear-cut boundaries.
Comprehensive Comparison Table
| Aspect | Discrete Data | Continuous Data |
|---|---|---|
| Definition | Countable, separate values with clear boundaries | Measurable values that can take any value within a range |
| Values | Whole numbers, distinct categories | Any real number, including decimals |
| Examples | Number of employees, product sales, survey responses | Temperature, weight, time, distance |
| Visualization | Bar charts, pie charts, histograms | Line graphs, scatter plots, area charts |
| Storage | Relational databases, structured formats | Time-series databases, streaming platforms |
| Analysis Methods | Frequency analysis, categorical statistics | Regression analysis, calculus-based methods |
| Measurement Precision | Exact counting | Limited by instrument precision |
Discrete Data: Countable and Clearly Defined
Discrete data consists of countable quantities or categorical values that can’t be broken down further. Examples include the number of products sold, ticket sales, or the count of customer reviews. These values are typically whole numbers, though some scenarios might include fractional discrete amounts—like selling half-chickens, which is still quantifiable but not continuous.
Businesses often rely on discrete data to track specific events or occurrences. For instance, a retailer might count the number of items sold on a given day or the total number of employees. These figures help in planning, inventory control, and workforce management because they represent concrete, indivisible units.
In spatial analysis, discrete data is represented as points, lines, or polygons with definite boundaries. These are known as thematic data because they classify areas into categories, such as zoning districts or soil types.
Discrete Data: Pros and Cons Analysis
✅ Advantages
- Easy to count and verify
- Clear, unambiguous values
- Simple statistical analysis
- Effective for categorical analysis
- Minimal storage requirements
- Easy data validation
❌ Limitations
- Limited granularity
- Cannot capture subtle changes
- May oversimplify complex phenomena
- Less suitable for trend analysis
- Rigid structure limits flexibility
- May miss intermediate values
Continuous Data: Measurements Over a Range
Continuous data represents measurements that can take on any value within a range, often including decimals or fractions. This type of data is common in scientific measurements, such as temperature, weight, or time. Unlike discrete data, continuous data can be divided into increasingly smaller units.
For example, customer service call durations can be recorded in seconds or milliseconds, and sales figures over a year can vary continuously day by day. Continuous data often requires more complex representation, such as histograms or line graphs, to show trends and variations over time or space.
In GIS, continuous data appears as surface data with values assigned to every point, like elevation or rainfall levels. These values don’t have abrupt changes and represent phenomena that vary gradually across space.
Continuous Data: Pros and Cons Analysis
✅ Advantages
- High precision and granularity
- Captures subtle variations
- Excellent for trend analysis
- Supports advanced statistical methods
- Real-time monitoring capabilities
- Flexible data representation
❌ Limitations
- Higher storage requirements
- Complex data management
- Measurement errors possible
- Requires specialized tools
- More expensive to collect
- Privacy concerns with streaming data
Continuous Surface Data Fixed to a Reference Point
One type of continuous data relates to surfaces measured relative to a fixed reference point. Elevation measured from sea level is a classic example. Each point on a map has an elevation value relative to that baseline, and these values form a continuous surface with no gaps.
Other examples include direction (aspect) where the angle is measured from fixed compass points, or temperature measured relative to absolute zero. This data type is essential for modeling natural phenomena and is widely used in environmental science, meteorology, and geospatial analysis.
Progressively Varying Continuous Data
Some continuous data change progressively as they move across a surface from a source. For instance, the concentration of salt in groundwater diminishes as it moves away from a salt deposit. Similarly, pollution spreads from a factory, and heat disperses from a fire.
These surfaces represent phenomena where the intensity gradually decreases with distance or changes based on the medium through which the substance moves. This type of data helps model processes like fluid flow, air movement, or chemical diffusion.
Mode of Locomotion and Movement Patterns
The way a phenomenon moves also affects continuous data surfaces. Movement can be through diffusion, where substances spread evenly over time, or through directed movement influenced by external forces.
For example, seed dispersal depends on the mode of locomotion—wind, animals, or humans—which shapes how seeds spread in the environment. Noise propagation from a source like a bomb blast depends on the physical properties of sound and the medium it travels through.
Understanding these movement patterns is important for modeling ecological processes, marketing reach, disease spread, and many other real-world phenomena.
Mixed or Continuum Features
Many real-world features don’t fit neatly into purely discrete or continuous categories. Instead, they exist on a continuum between the two. For example, soil types may gradually change from one type to another without sharp boundaries, and forest edges or wetland boundaries can be fuzzy.
In data terms, these are mixed features where part of the data is discrete, and part is continuous. Representing such data accurately requires flexible tools like raster grids or probabilistic models.
GIS and statistical software often provide ways to handle mixed data, improving the accuracy of spatial analyses and modeling.
Industry-Specific Case Studies
🏥 Healthcare Industry: Patient Monitoring System
Challenge: A hospital needs to monitor patient health while managing administrative data.
Discrete Data Implementation:
- Patient ID numbers and room assignments
- Number of medications prescribed
- Staff shift schedules and headcount
- Admission and discharge counts
Continuous Data Implementation:
- Heart rate, blood pressure, and temperature monitoring
- IV fluid flow rates
- Oxygen saturation levels
- Drug concentration in blood
Outcome: The hospital improved patient care by 35% through real-time continuous monitoring while maintaining efficient administrative operations with discrete data tracking.
🏪 Retail Industry: Smart Inventory Management
Challenge: A major retailer wanted to optimize inventory while understanding customer behavior.
Discrete Data Application:
- Product units sold per day
- Number of customer transactions
- Store locations and employee count
- Product categories and SKUs
Continuous Data Application:
- Customer dwell time in stores
- Temperature and humidity monitoring
- Real-time sales revenue streams
- Website traffic and engagement duration
Results: 28% reduction in inventory costs and 42% improvement in customer satisfaction through data-driven insights.
🌾 Agriculture: Precision Farming
Challenge: Modern farms need to maximize yield while minimizing resource waste.
Discrete Data Usage:
- Number of plants per acre
- Harvest quantities (bushels, tons)
- Equipment count and maintenance schedules
- Field sections and crop types
Continuous Data Usage:
- Soil moisture and pH levels
- Temperature and rainfall measurements
- GPS coordinates for precision planting
- Nutrient concentration in soil
Impact: 22% increase in crop yield and 30% reduction in water usage through integrated data monitoring.
🏭 Manufacturing: Quality Control System
Challenge: An automotive manufacturer needed to ensure product quality while tracking production efficiency.
Discrete Data Elements:
- Number of defective parts per batch
- Production line stops and startups
- Worker attendance and shifts
- Completed vehicles per day
Continuous Data Elements:
- Machine vibration and temperature
- Paint thickness measurements
- Assembly line speed
- Energy consumption patterns
Achievement: Reduced defect rates by 45% and increased overall equipment effectiveness by 33%.
Importance of Identifying Data Type
Knowing whether data is discrete or continuous is crucial because it determines how the data should be collected, analyzed, visualized, and protected. Using the wrong methods can lead to inaccurate results and poor decision-making.
For instance, applying continuous data models to discrete data can blur important boundaries, while treating continuous data as discrete may oversimplify trends. Visualization methods differ: bar charts work well for discrete counts, whereas line graphs and histograms suit continuous trends.
In business, discrete data might guide staffing or inventory decisions, while continuous data helps forecast sales or monitor operational efficiency. In GIS, discrete data maps legal boundaries, whereas continuous data models natural landscapes.
Data Visualization Comparison
Continuous Data: Temperature
Tools and Technologies for Managing Discrete and Continuous Data
Managing these data types requires different technologies. Discrete data fits well in relational databases like SQL servers, which handle precise, structured records. GIS platforms manage discrete spatial data as vector features—points, lines, polygons.
Continuous data often involves large-scale time series or sensor data, requiring specialized time-series databases or big data platforms like Apache Kafka or InfluxDB. GIS handles continuous data as raster grids, storing values for each cell representing measurements across surfaces.
Some tools combine both, such as ArcGIS, enabling complex analyses that mix discrete and continuous spatial data.
Technology Stack Comparison
| Technology Layer | Discrete Data Tools | Continuous Data Tools |
|---|---|---|
| Databases | MySQL, PostgreSQL, Oracle | InfluxDB, TimescaleDB, Apache Cassandra |
| Streaming | Apache Kafka (batch) | Apache Kafka Streams, Apache Storm |
| Analytics | Tableau, Power BI, Excel | Grafana, Kibana, Apache Superset |
| Programming | SQL, Python pandas | Python (NumPy/SciPy), R, MATLAB |
| Cloud Platforms | AWS RDS, Azure SQL | AWS Timestream, Azure Time Series |
Applications and Case Studies
Across industries, understanding discrete and continuous data improves outcomes.
- Urban Planning: Discrete land parcels combined with continuous environmental data help balance development and sustainability.
- Healthcare: Patient records (discrete) and vital signs monitoring (continuous) together inform treatment.
- Retail: Sales counts (discrete) alongside web traffic duration (continuous) optimize marketing and inventory.
These examples show how mixing data types provides a fuller picture.
Data Protection and Business Continuity Implications
Data protection strategies must account for the nature of data. Discrete data, such as customer records, requires strong privacy controls and secure backups to prevent loss or unauthorized access.
Continuous data, like real-time sensor streams or transaction logs, needs continuous data protection (CDP) technologies to capture every change and minimize data loss. CDP enables rapid recovery and ensures business continuity, especially for critical operational data.
Knowing data types helps organizations plan appropriate backup frequency, recovery methods, and compliance approaches, protecting against downtime and data breaches.
🔑 Key Takeaway
The most effective data strategies combine both discrete and continuous data types. Modern organizations use discrete data for clear business metrics and decision points, while leveraging continuous data for real-time insights and predictive analytics. The key is choosing the right data type for each specific use case and having the technological infrastructure to handle both effectively.
Future Trends in Data Handling
As data volumes grow, integrating discrete and continuous data will become more common. Advances in AI and real-time analytics will leverage continuous streams for instant insights, while discrete data will improve segmentation and targeting.
IoT and sensor networks will increase continuous data generation, demanding scalable storage and protection. Data governance will evolve to address privacy and security challenges across data types.
Discrete and continuous data represent two fundamental ways to describe the world quantitatively
Discrete data counts separate, identifiable units, while continuous data measures smoothly varying quantities. Both are vital in business, science, and technology, influencing how data is collected, analyzed, visualized, and protected.
Understanding their differences ensures better data accuracy and helps organizations use their data effectively. As technology advances, blending these data types will unlock richer insights and more resilient operations.